原文标题:4 Types of Memory Leaks in JavaScript and How to Get Rid Of Them
紧接着上一篇文章,沿着有关 JavaScript 内存泄漏的话题,接着来讲解 Chrome 开发者工具关于内存分析的使用。
Chrome provides a nice set of tools to profile memory usage of JavaScript code. There two essential views related to memory: the timeline view and the profiles view.
Chrome 提供了一系列优秀的工具来分析 JavaScript 代码中内存的使用。有两个和内存相关的重要面板:timeline 和 profile。
Timeline 面板

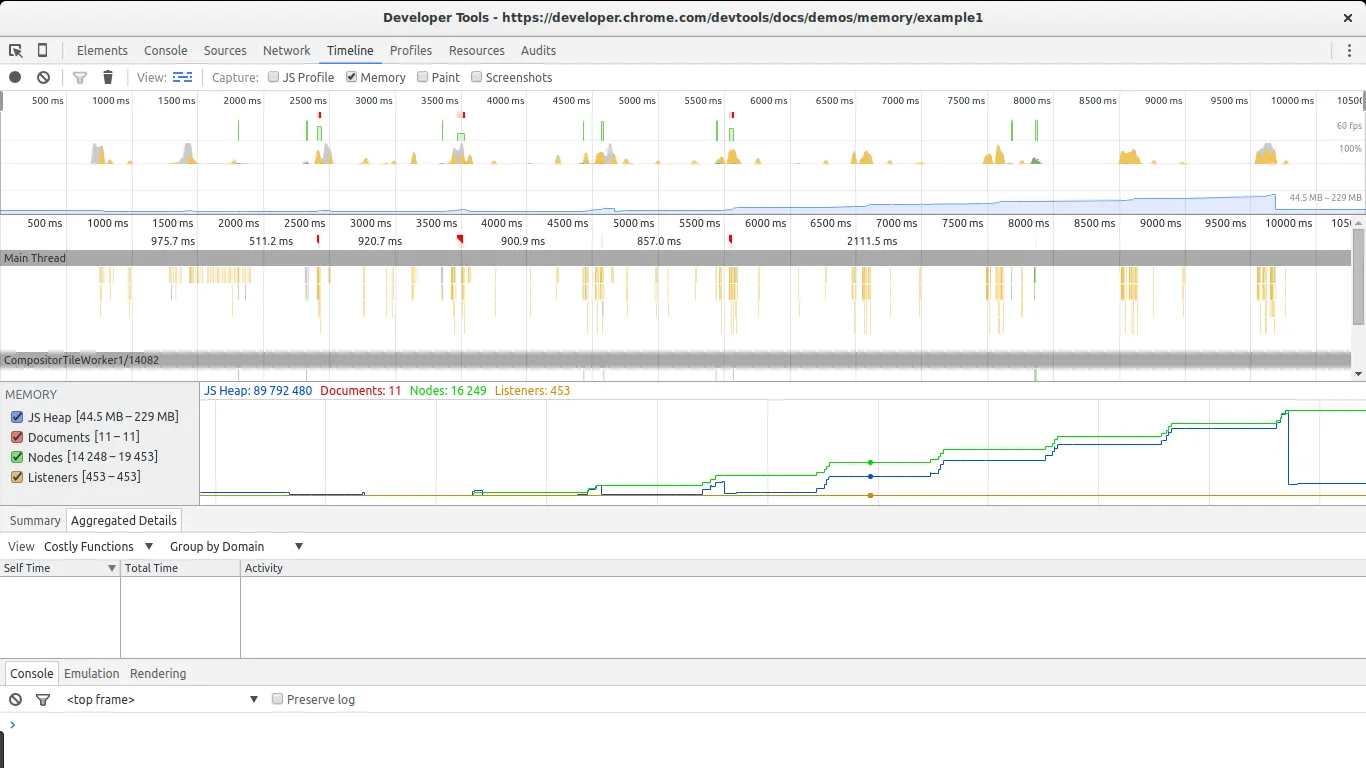
The timeline view is essential in discovering unusual memory patterns in our code. In case we are looking for big leaks, periodic jumps that do not shrink as much as they grew after a collection are a red flag. In this screenshot we can see what a steady growth of leaked objects can look like. Even after the big collection at the end, the total amount of memory used is higher than at the beginning. Node counts are also higher. These are all signs of leaked DOM nodes somewhere in the code.
timeline面板时发现代码中不寻常内存模式必不可少的工具。假设我们正在寻找严重泄漏,红色标记的周期性猛涨不会随着他们的增长而收缩。在这个截图中我们可以看到泄露对象稳定增长是什么样子的。即使在最后的一次大回收之后,整个使用的内存量也比刚开始的时候高。节点的数量也更高。这些都标志着在代码的某处存在泄露的DOM节点。
Profiles view 性能视图

This is the view you will spend most of the time looking at. The profiles view allows you to get a snapshot and compare snapshots of the memory use of your JavaScript code. It also allows you to record allocations along time. In every result view different types of lists are available, but the most relevant ones for our task are the summary list and the comparison list.
这就是那个将花费你大部分时间的视图。它允许你获得一个快照,并且可以比较那些你的js代码内存使用情况的快照。 还可以随着时间记录内存的分配。在每一个结果视图中,可以获得不同类型的列表,但是对我们的任务来说最有用的几个是summary list和 comparison list
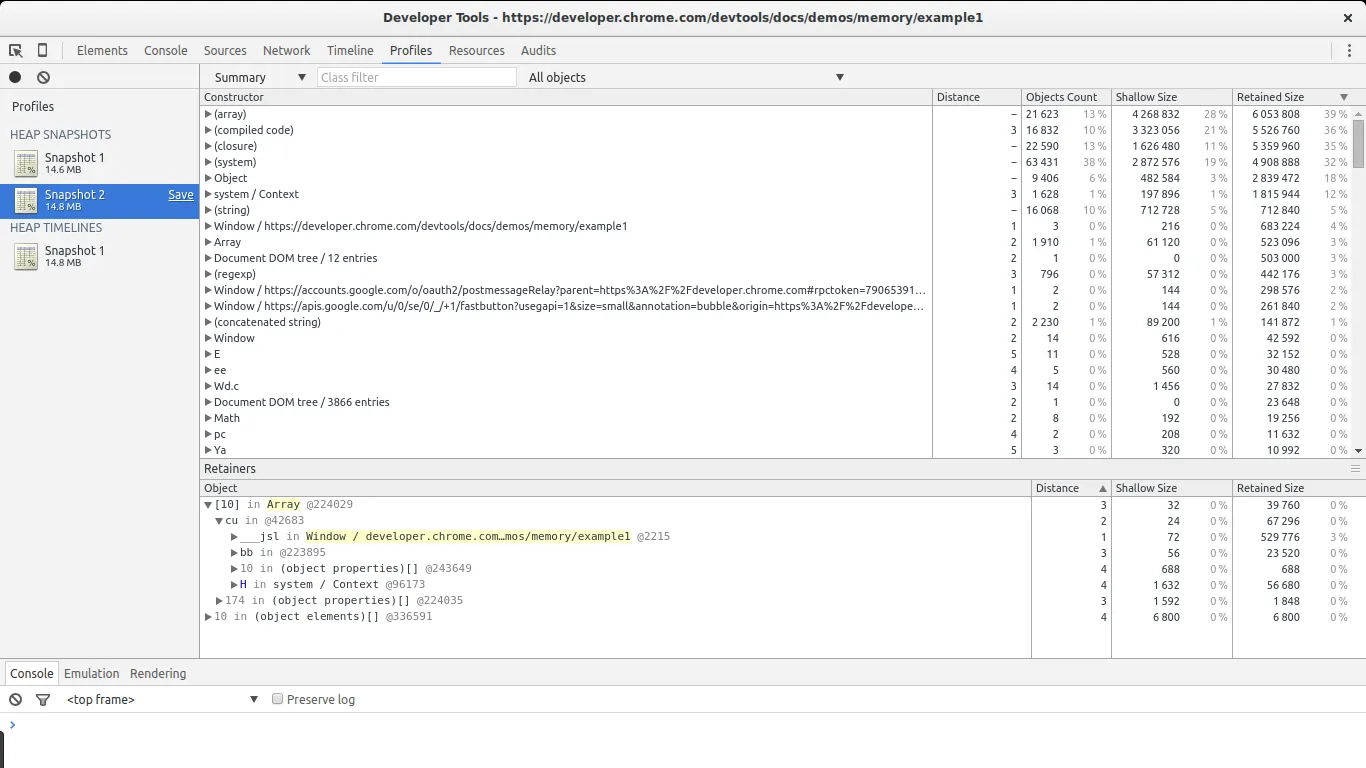
The summary view gives us an overview of the different types of objects allocated and their aggregated size: shallow size (the sum of all objects of a specific type) and retained size (the shallow size plus the size of other objects retained due to this object). It also gives us a notion of how far an object is in relation to its GC root (the distance).
summary视图向我们呈现了不同类型对象的分配和他们合计大小的概览:shallow size(所有对象中特殊类型的总和)和retained size(shadllow size加上retained size就是这个对象),这也给了我们一个概念:一个对象离GC的root有多远(距离)。
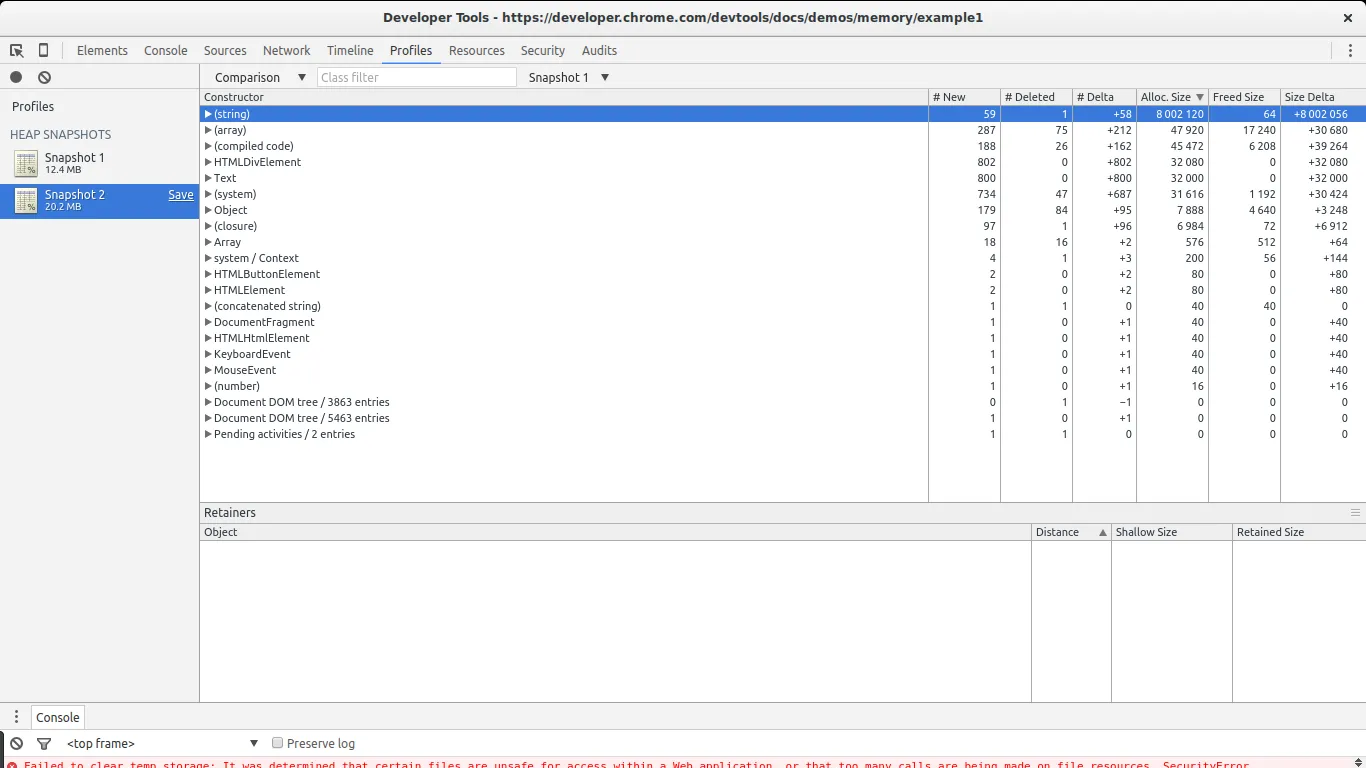
The comparison list gives us the same information but allows us to compare different snapshots. This is specially useful to find leaks.
comparison list 呈现相同的内容但是允许我们比较不同的快照。对于寻找内存泄漏来说这特别又有。
Example: Finding Leaks Using Chrome
本质上来说有两种类型的内存泄漏:一种是周期性地增加内存的使用,另一种是只发生一次,不会进一步增加内存的使用。很明显,当内存泄漏周期性增长时是很容易发现的。这也是最麻烦的一个地方:如果内存随着时间增加,这种类型的泄漏最终将导致浏览器变得缓慢或者停止执行脚本。非周期性增长的内存泄漏在它们足够大以至于在所有的分配中很明显时很容易被发现。通常来说这都不是问题,所以他们经常被忽视。
For our example we will use one of the examples in Chrome’s docs. The full code is pasted below:
在我们的例子中。我们将使用 Chrome 文档中的一个例子。完整的代码如下:
var x = [];

function createSomeNodes() {
    var div,
        i = 100,
        frag = document.createDocumentFragment();
    for (;i > 0; i--) {
        div = document.createElement("div");
        div.appendChild(document.createTextNode(i + " - "+ new Date().toTimeString()));
        frag.appendChild(div);
    }
    document.getElementById("nodes").appendChild(frag);
}
function grow() {
    x.push(new Array(1000000).join('x'));
    createSomeNodes();
    setTimeout(grow,1000);
}
When grow is invoked it will start creating div nodes and appending them to the DOM. It will also allocate a big array and append it to an array referenced by a global variable. This will cause a steady increase in memory that can be found using the tools mentioned above.
当grow被调用时,它会开始创建 div 节点,然后将它们插入到 DOM 中。同时也会分配一个大数组将这个数组插入到被一个全局变量引用的数组中。这会导致内存使用的稳定增长,使用上面提到的工具可以发现这个增长。
Garbage collected languages usually show a pattern of oscillating memory use. This is expected if code is running in a loop performing allocations, which is the usual case. We will be looking for periodic increases in memory that do not fall back to previous levels after a collection.
垃圾回收语言通常会呈现一个振荡内存使用的模式。如果代码在一个执行分配的循环中运行,这是预料之中的,这是一个常见的问题。我们将寻找内存中的周期增长,这些增长不会在执行一次收集之后下降到之前的水平。
Find out if memory is periodically increasing
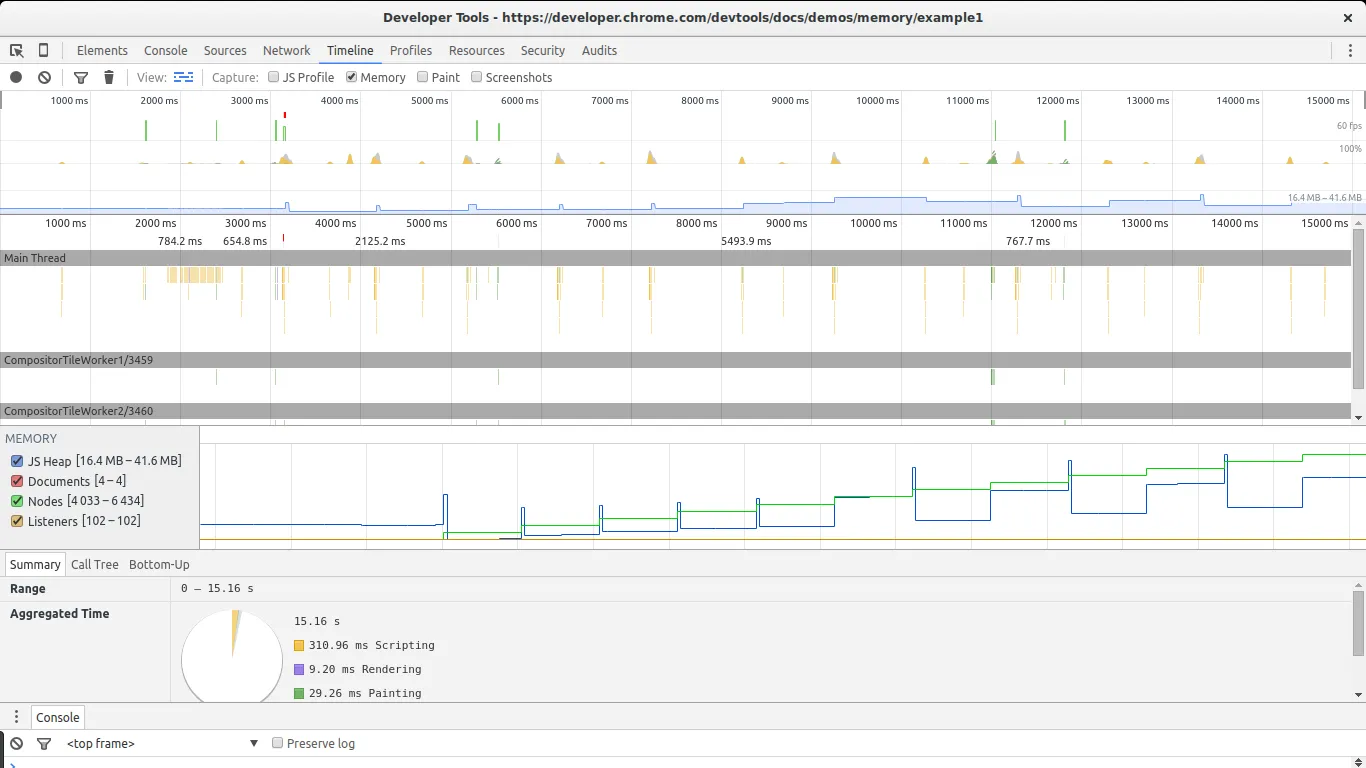
The timeline view is great for this. Open the example in Chrome, open the Dev Tools, go to timeline, select memory and click the record button. Then go to the page and click The Button to start leaking memory. After a while stop the recording and take a look at the results:
打开 Chrome 中的例子,打开开发者工具,切换到timeline面板,选择memory,点击record按钮。然后点击The Button开始泄漏内存。过了一会停止记录,查看结果:

This example will continue leaking memory each second. After stopping the recording, set a breakpoint in the grow function to stop the script from forcing Chrome to close the page.
这个例子每一秒钟都将会继续泄漏内存。暂停记录之后,在 grow 函数中设置一个断点来停止脚本强制 Chrome 关闭页面。
There are two big signs in this image that show we are leaking memory. The graphs for nodes (green line) and JS heap (blue line). Nodes are steadily increasing and never decrease. This is a big warning sign.
在上图中有两个大信号告诉我们内存正在泄漏。绿线表示 DOM 节点,蓝线表示js内存堆。节点正在稳定地增长并且从来没有下降。这是一个大的警告标志。
The JS heap also shows a steady increase in memory use. This is harder to see due to the effect of the garbage collector. You can see a pattern of initial memory growth, followed by a big decrease, followed by an increase and then a spike, continued by another drop in memory. The key in this case lies in the fact that after each drop in memory use, the size of the heap remains bigger than in the previous drop. In other words, although the garbage collector is succeeding in collecting a lot of memory, some of it is periodically being leaked.
JS 内存堆也表现出内存使用的稳定地增长。由于垃圾回收的影响更难看到这个增长。你可以看到一个初始内存增长的模式。后面接着一个大的下降,接着一个增长形成一个突刺,接着又是一个下降。这个案例的关键在于每次内存使用量的下跌,内存堆的剩余大小都比之前的下跌之后的内存堆多。换句话说,虽然垃圾回收器成功地回收了很多内存,但是一些内存还是周期性地泄漏了。
We are now certain we have a leak. Let’s find it.
现在我们确定了我们存在内存泄漏,让我们来解决它
Get two snapshots
To find a leak we will now go to the profiles section of Chrome’s Dev Tools. To keep memory use in a manageable levels, reload the page before doing this step. We will use the Take Heap Snapshot function.
为了找到泄漏,我们将切换到开发者中的 profiles 面板。为了将内存的使用保持在可操纵的水平,在动手之前重新加载页面。我们将使用获取内存堆快照的功能。
Reload the page and take a heap snapshot right after it finishes loading. We will use this snapshot as our baseline. After that, hit The Button again, wait a few seconds, and take a second snapshot. After the snapshot is taken, it is advisable to set a breakpoint in the script to stop the leak from using more memory.
重新加载页面,并且在完成之后拍一张内存堆得快照。我们将使用这个快照作为我们的基线。在那之后,按下The Button按钮,等待几秒钟,接着拍第二张快照。第二张快照完成之后,在代码中打一个断点阻止泄漏更多的内存是明智的。
